If equity is a top priority in many districts, it is not apparent from the most recent round of state ESSA spending reports, an advocacy organization says.
Only one state, Illinois, provided enough transparent detail to allow advocates to analyze resource inequities and the action being taken to address them, according to “Going Beyond ESSA Compliance,” an interactive report and web tool produced by The Education Trust.
The 49 other states are missing an opportunity to help advocates better assess the fairness of school spending patterns, said Reetchel Presume, Ed Trust’s P-12 data and policy analyst.
“Transparency in school spending is crucial for identifying inequities in school funding that deny students of color and those from families with low incomes the resources they need to excel,” Presume said. “For advocates and policymakers alike, school spending reports could be a tool to see if school systems are shortchanging students.”
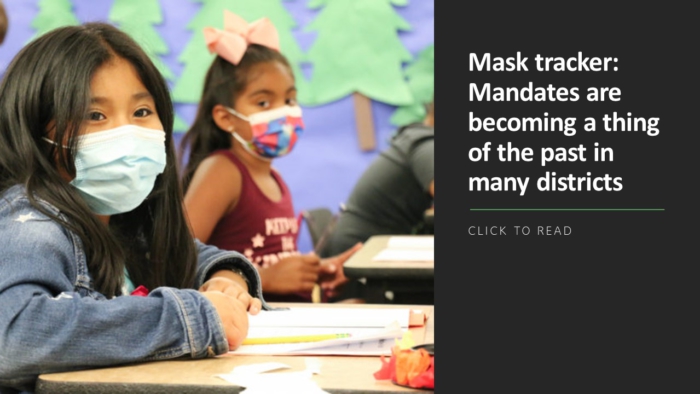
School mask tracker: Who is and isn’t loosening the rules
The urgency for transparency has been increased as states and schools begin to spend nearly $125 billion in American Rescue Plan recovery funding to help the most impacted and underserved students bounce back from the pandemic’s disruptions.
In their most recent reports, just 17 states included spending comparisons across all schools in a district or in the state. Only five states—Arkansas, Illinois, Oklahoma, New Hampshire, and Tennessee—included visualizations of spending based on student need.
Ten states did not even meet the federal financial reporting laws, which must detail per-pupil spending and include source data for each school and local education agency in the state, Ed Trust said.
The report’s website allows users to see how each state’s spending report stacks up against The Education Trust’s guiding principles for equity-oriented school spending reports, which focus on five core elements:
- Total & detail: Providing total per-pupil spending at each school, as well as detail by source of funds and location of spending, gives stakeholders a starting point for comparisons and further analysis.
- Context: Contextual information about student and school characteristics (e.g., the percentage of students from low-income backgrounds) allows advocates to interpret differences in spending.
- Comparisons: Comparisons to spending in other schools reveal if differences in spending align with differences in student needs.
- Beyond money: Including information on schools’ non-financial resources provides a clearer picture of resource equity.
- Accessibility: Visualizations helps stakeholders understand the data better and engage in more productive conversations
Illinois’ spending report, for example, contains student demographics as well as performance and facilitates comparisons across schools in a district. The state’s “Site-Based Expenditure Report” was the product of a two-year collaborative planning process that was informed by a diverse set of stakeholders.
“Different schools within the same district may have different student needs,” Illinois Superintendent of Education Dr. Carmen I. Ayala said. One school may serve more students with disabilities. One school may serve more English Learners. School size and grade band can also impact students’ needs and district spending.”


