It’s that time of year when the senior class is entering the process of narrowing down which college or university they hope to attend. One of the prerequisites to this moment is perhaps the most anticipated exam a student has to endure: the SAT.
And this year’s round of test takers produced the lowest national average since the test was revamped in 2016, despite a 10% increase in participation levels.
That’s according to a new analysis from Scholaroo that determines where each state ranks based on their students’ SAT scores in 2023. The researchers calculated overall scores by comparing student performance to “peers of the same age and academic background,” the report reads.
“The results gauge the success of current SAT test takers and assess nationwide education quality,” the researchers add.
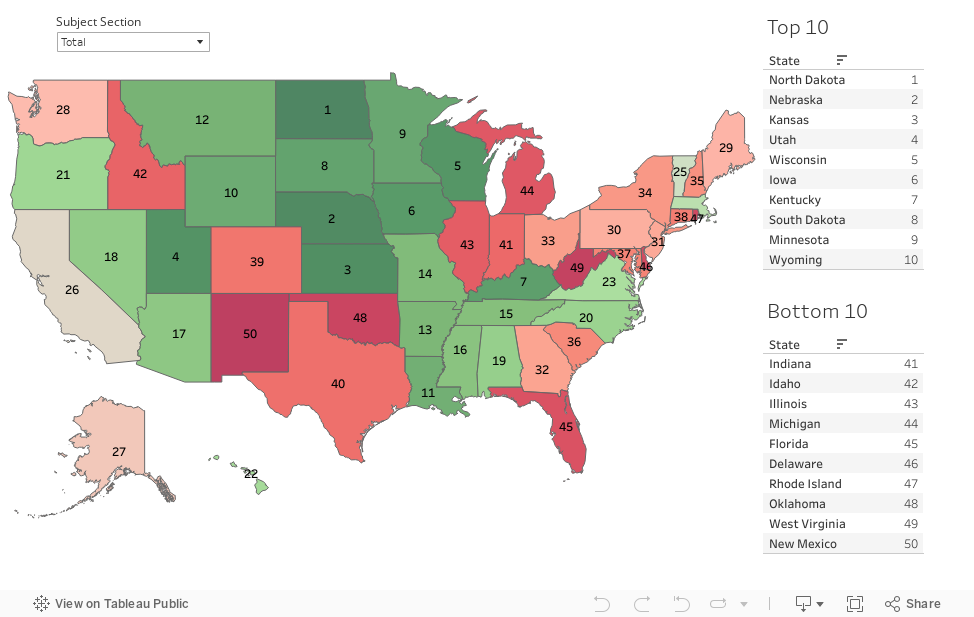
Across all 50 states, North Dakota earned the No. 1 spot for having the highest average SAT score of 1,287. Conversely, New Mexico fell four spots since last year now ranking last with an average score of 901.
More from DA: Will K12 districts even notice if the government shuts down?
What’s important to keep in mind, however, is the vast difference in the number of test takers across states. For instance, the data suggests that North Carolina saw 27,803 test takers compared to Alabama’s 1,512.
With that in mind, here’s a look at the top—and bottom—10 states based on 2023 SAT scores:
Top 10
- North Dakota: 1,287
- Nebraska: 1,252
- Kansas: 1,245
- Utah: 1,239
- Wisconsin: 1,236
- Iowa: 1,208
- Kentucky: 1,208
- South Dakota: 1,208
- Minnesota: 1,201
- Wyoming: 1,200
Bottom 10 (from best to worst)
- Indiana: 971
- Idaho: 970
- Illinois: 970
- Michigan: 967
- Florida: 966
- Delaware: 958
- Rhode Island: 958
- Oklahoma: 953
- West Virginia: 923
- New Mexico: 901

